| meaptrendkenwoodmath.pdf |
Drilling Deeper into that Gap
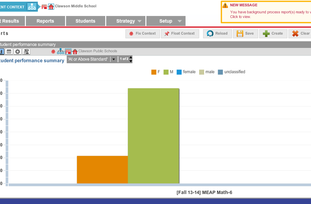
Thing 18 provided me with a chance to drill deeper into the data regarding the gender gap in Math at one of of our elementary schools. The good news is the gender gap has recently shifted. The bad news is that the male scores and percentage scoring proficient has plummetted. The 2012-13 male cohort did exceptionally well, and that caused an eyebrow to be raised about the gap. I was able to create a report on some of that cohort group and how they did on the 6th grade 2013-14 MEAP. Mind you, some of our pals from this group may have left the district for other pastures. But the remnant of that group has scored well on their first middle school high-stakes endeavor. Unfortunately, the girls continue to lag far behind. I extended my investigation to look at our recently implemented iReady scores, seeking an indicator of things to come in the upcoming MEAPS, M Step, Smarter Balanced (or whatever tests lay in wait down the road_.
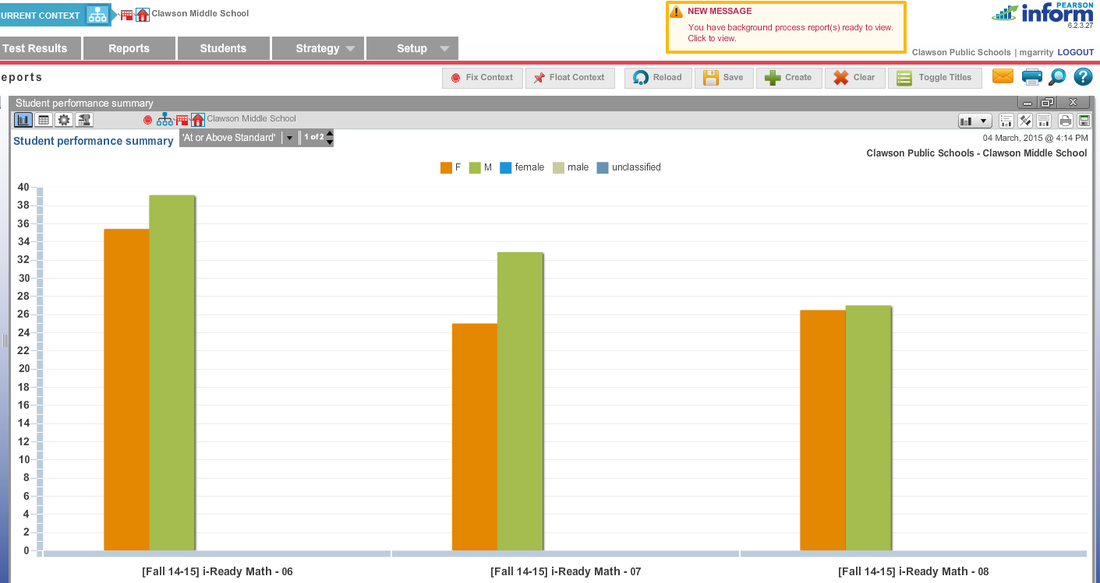
Looking at the "early" iReady data it confirms the gap with this cohort group of students (note the middle bars on the right lower). Perhaps when the state settles on a test, we might be able to do a correlation between our students' iReady scores and whatever test-de-jour we happen to land on.
Thing 18 provided me with a chance to drill deeper into the data regarding the gender gap in Math at one of of our elementary schools. The good news is the gender gap has recently shifted. The bad news is that the male scores and percentage scoring proficient has plummetted. The 2012-13 male cohort did exceptionally well, and that caused an eyebrow to be raised about the gap. I was able to create a report on some of that cohort group and how they did on the 6th grade 2013-14 MEAP. Mind you, some of our pals from this group may have left the district for other pastures. But the remnant of that group has scored well on their first middle school high-stakes endeavor. Unfortunately, the girls continue to lag far behind. I extended my investigation to look at our recently implemented iReady scores, seeking an indicator of things to come in the upcoming MEAPS, M Step, Smarter Balanced (or whatever tests lay in wait down the road_.
Looking at the "early" iReady data it confirms the gap with this cohort group of students (note the middle bars on the right lower). Perhaps when the state settles on a test, we might be able to do a correlation between our students' iReady scores and whatever test-de-jour we happen to land on.
 |  |
Manipulating and Presenting that Perception Data
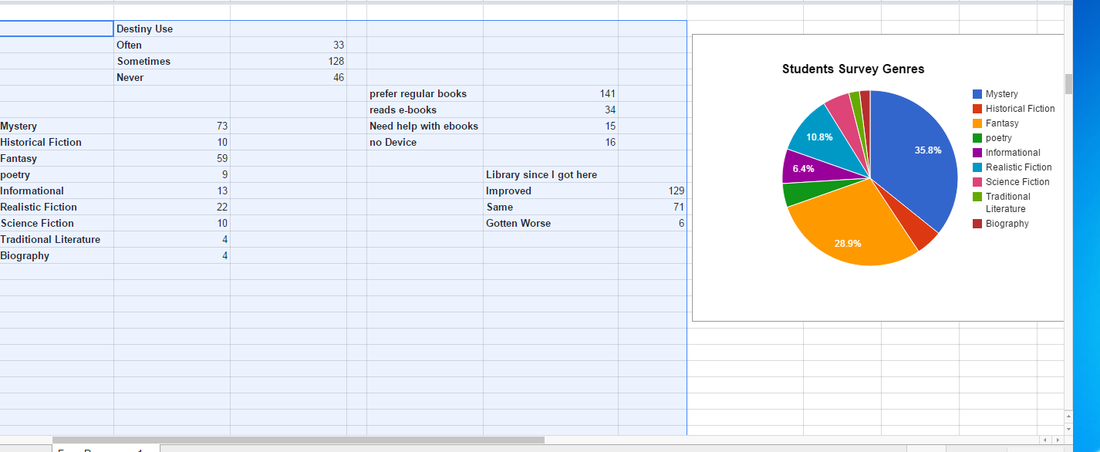
Earlier, I used Google Form to survey my elementary students about a.) their overall library experience b.) their preferred genres, and c.) where they stand on using e-books. I used the generated Google Sheets document, but needed to package it a little more concise, to share with my media-techs and my principals. The link to the sheet for one of the schools I manage is here: Schalm Survey. I used the countif function to tally my responses. I also created a pie chart to make collection development a little easier for my staff and me. These totals are at the bottom of the sheet, but I also took a snapshot to make it easier for casual use.
Earlier, I used Google Form to survey my elementary students about a.) their overall library experience b.) their preferred genres, and c.) where they stand on using e-books. I used the generated Google Sheets document, but needed to package it a little more concise, to share with my media-techs and my principals. The link to the sheet for one of the schools I manage is here: Schalm Survey. I used the countif function to tally my responses. I also created a pie chart to make collection development a little easier for my staff and me. These totals are at the bottom of the sheet, but I also took a snapshot to make it easier for casual use.
Future Use of Spreadsheet and Survey in my Classroom
I will continue to use Google forms to collect data as a teacher, but I am also teaching the students to use Sheets. I have an upcoming lesson where students will copy and past the data for the Detroit Tigers Roster from the MLB website and manipulate the data to answer queries that I provide them. I am doing this with our fourth graders. I will also teach them to graph, although I am running across several deficiencies when students use the Google Sheets versus good ole Excel. But the benefits of cloud computing merit the shift from Microsoft Office to the Google Tools.
I will continue to use Google forms to collect data as a teacher, but I am also teaching the students to use Sheets. I have an upcoming lesson where students will copy and past the data for the Detroit Tigers Roster from the MLB website and manipulate the data to answer queries that I provide them. I am doing this with our fourth graders. I will also teach them to graph, although I am running across several deficiencies when students use the Google Sheets versus good ole Excel. But the benefits of cloud computing merit the shift from Microsoft Office to the Google Tools.
 RSS Feed
